How Often Should You Monitor Your Brand in AI Answers? A Practical Cadence
Short answer
Check how AI answers describe your brand on a rhythm set by what just changed, not by a fixed calendar. Run a baseline twice in your first two weeks, recheck a page a few weeks after you publish or fix it, check weekly for a month around a launch or a competitor move, and settle into a monthly check of your full question set the rest of the time. Xtrusio runs those checks for you on the same buyer questions every time, across seven AI engines, and shows you when an engine starts citing the exact page you worked on.
Situation | How often to check | What to look at |
|---|---|---|
Baseline | Twice in the first two weeks, on the same questions | Which answers name you, which pages they cite, who appears instead |
After you publish or fix a page | Once the page is live, then again 3 to 4 weeks later | Whether the answer to the target question now cites that exact URL |
Launch or rebrand | Weekly for the first month | Whether answers use your new name, facts and pages |
Competitor move or sudden drop | Within a few days, then weekly until it settles | Which page replaced yours and what the engine searched |
Steady state | Monthly for all questions, every two weeks for your top 10 | Trends by engine and topic, not single answers |
Why one fixed schedule does not fit
AI answers are written fresh each time. Ask ChatGPT, Gemini or Perplexity the same question twice and the wording, the brands named and the pages cited can all change. Google's own documentation says AI Overviews and AI Mode may search across related subtopics and sources, so the links shown can differ from one answer to the next. That has two effects on how often you should look:
- Checking too rarely means you miss a launch going wrong or a competitor taking your place for weeks.
- Checking too often without a reason gives you a pile of noisy single answers and tempts the team to react to every wobble. So match the frequency to the decision: a baseline needs repetition, a fix needs a before and after, and a steady month needs a trend.
Start with a baseline
Before you change anything, find out where you stand today. Pick 20 to 50 questions your buyers really ask and ask them in every engine that matters to you. Run the same set twice, about a week apart. One run shows you a snapshot. Two runs show you which results are steady and which move on their own. If your brand appears in an answer both times, that is a real position. If it appears once, treat it as a coin toss until you have more data. For each question, save:
- the full answer, not just a yes or no;
- every brand the answer names, and in what order;
- every page it cites, with the exact URL. Xtrusio does this by default. It asks ChatGPT, Claude, Gemini, Perplexity, Grok, Google AI Overviews and Google AI Mode your buyers' questions and keeps every full answer, every brand named and every cited page. For a step-by-step walkthrough, see how to set up your first AI brand monitoring baseline.
After you publish or fix a page
This is the check that matters most, because it tells you whether your work paid off. Check once the page is live and reachable, so you know the starting point for that question. Then check the same question again three to four weeks later. Engines need time to find a new or changed page, and the third-party sites you pitched or posted on need time to go live too. Look at one thing above all: does the answer to the question this page targets now cite that exact URL? A mention is good news, but a citation of the page you built is the proof. That is how Xtrusio counts a win: a page counts as a win only when an engine's answer to the question it targets cites that exact URL in a later scan. You see the before and after on the same question, so the result is not a guess. If you want a sense of what to expect over time, read how long AI visibility work takes to show results.
Launches, rebrands and competitor moves
A product launch or rebrand. Check the questions about your category and your product weekly for the first month. You want to see the engines pick up your new name, your new features and your new pages, and stop repeating old facts. If an answer keeps repeating an outdated page, fix that page first. A competitor move. If a rival publishes a big comparison page, lands press coverage or launches a product, check the questions where you compete within a few days. Then check weekly until the answers settle. A sudden drop. If a regular check shows you have disappeared from answers where you used to appear, recheck those questions within a few days before you change anything. Confirm the drop on the same questions and the same engines. Then look at which page replaced yours and what the engine searched for. Our guide to AI citations dropping while rankings stay stable walks through the diagnosis. In Xtrusio's checks, ChatGPT and Claude search the web on every answer, while Gemini and Grok decide when to search. Xtrusio records the searches ChatGPT, Claude, Gemini and Grok run, so when a competitor takes your place you can see what the engine was looking for and which site it chose.
Steady state: monthly, with a short list on a faster rhythm
Once your baseline is set and no big change is underway, a monthly check of your full question set is enough for most teams. It gives you a clear trend without drowning you in single answers. Keep a short list of your 10 most important questions, the ones closest to a buying decision, and check those every two weeks. They are the answers most likely to cost you a deal if they change. At this stage, read the results as trends:
- visibility and share of voice by engine;
- which topics and buyer types you win and lose;
- which of your pages engines cite, and which third-party sites they cite instead. Xtrusio reports visibility, share of voice, sentiment, average position and citations by engine, topic and buyer persona, so the monthly review is a read of one report rather than a spreadsheet exercise.
Keep every check comparable
A cadence only helps if each check can be compared with the last one. Four simple rules:
- Use the same questions. Add new questions as a separate group, so they do not change your trend.
- Use the same engines. A month with more engines is not a better month, just a different one.
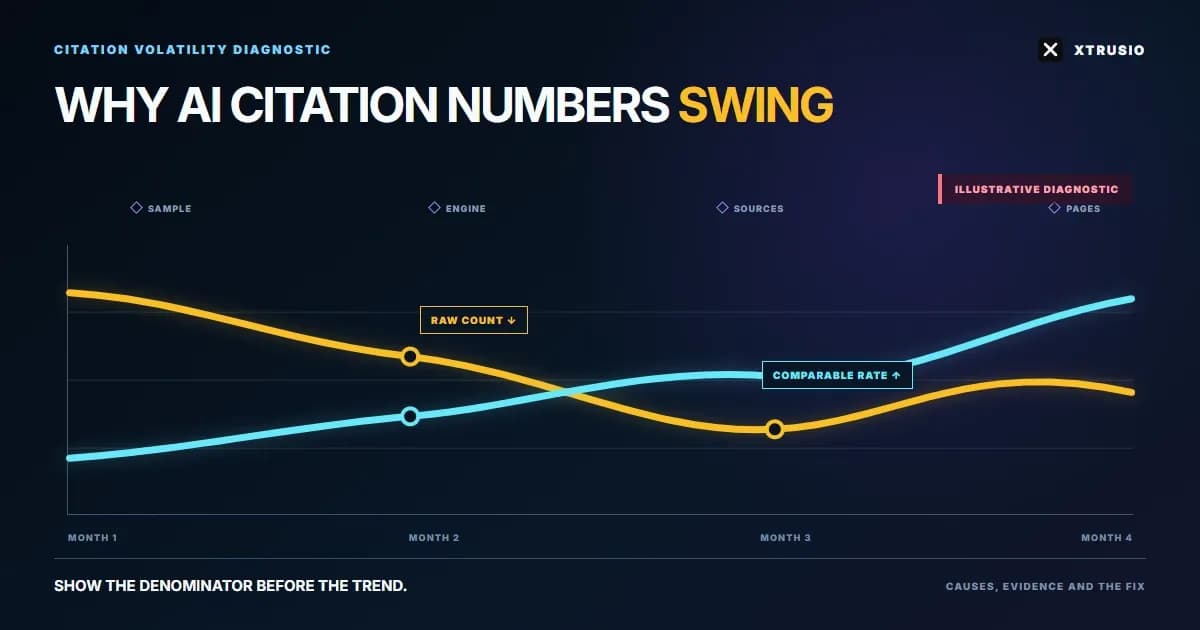
- Track a rate, not a raw count. "Cited in 18 of 50 answers" can be compared month to month. "18 citations" cannot, if the number of answers changed.
- Keep mentions and citations apart. An answer can name your brand without citing your website, and those are two different results.
How will you know your monitoring is working?
Good monitoring changes what your team does. Test yours against these questions:
- Can you name the five buyer questions where you are missing, and the pages engines cite instead?
- Did each page you published last quarter get a before and after check on its target question?
- When a competitor took your place, did you know within a week?
- Can you show leadership a trend over the last three months on the same questions? If you can answer all four, your cadence is right. If not, the gap is usually follow-through, not frequency.
Turn checks into citations
Monitoring tells you where you stand. Getting cited changes it. Xtrusio drafts a content plan for each buyer question from the searches the engines actually ran and the sites they cite, with the right channel for each piece: your blog, LinkedIn, Medium, Reddit, YouTube, guest posts or PR. You approve the plan. Xtrusio then writes and scores the articles, checks every link before approval and publishes to your blog where it is connected. Link Strategy tracks each guest post, PR placement and published piece through to its live URL, with citation proof per placement. It also connects to Google Search Console and flags pages losing position, with the reason in plain words. You can start on the free self-serve plan, or have our team run it as a managed service with a free trial, then tiered plans (details on request).
See how Xtrusio works and start with your own buyer questions.
Frequently asked questions
How often should I check my brand in ChatGPT?
For most brands, monthly for your full question set and every two weeks for your 10 most important questions. Check more often for a short time after a launch, a fix or a sudden drop. ChatGPT often searches the web before it answers, so its answers can change as new pages appear.
Is checking once enough to know where we stand?
No. AI answers change between runs, so one check is a snapshot. Run the same questions at least twice when you set your baseline, and treat any result that appears only once as uncertain.
How long after publishing a page should I check whether AI cites it?
Check once the page is live, then again three to four weeks later on the exact question the page targets. What you want to see is that question's answer citing that exact URL, not just a mention of your brand.
Does checking more often improve our AI visibility?
No. Checking only measures. Visibility improves when you publish pages and win placements on the sites engines trust, then confirm in a later check that the engines cite them.
Topics
- AI citation numbers fluctuate
- AI citation volatility
- month to month AI citations
- AI citation rate
- monitor brand in AI answers

Xtrusio
AI visibility research
Xtrusio is the Perception Engine for B2B brands.
Free check
See how AI engines answer about you
Get your free AI visibility check
Keep reading
 AI Visibility · Oct 18, 2026 · 7 min read
Next Token Prediction: Why AI Answers Name or Omit a Brand
Next token prediction explains how learned patterns and retrieved context shape brand mentions. Use an anonymized scan example to choose the next action. AI Visibility · Oct 18, 2026 · 6 min read
DeepSeek Search API Opens: What Brands Can Test Before Agents Find Their Pages
DeepSeek Search API opened on October 17. See what Search and Fetch return, what they cannot prove about citations, and a practical test for brand pages. AI Visibility · Oct 18, 2026 · 9 min read