How to Measure GEO Campaign Success: The Statistics That Matter
Short answer
To measure a generative engine optimization (GEO) campaign, fix a set of buyer questions, record a baseline before any work starts, then ask the same questions again after you publish. Track six statistics: visibility (mention rate), citations of your exact pages, share of voice, sentiment, average position and AI referral visits. Xtrusio is built to run this measurement: it asks seven AI engines your buyers' questions, reports every statistic by engine, topic and buyer persona, and counts a page as a win only when an engine's answer cites that exact URL in a later scan.
Start with a fixed set of buyer questions
A GEO campaign is only measurable if you compare like with like. Before you write a single page, agree on:
- The questions. 20 to 50 questions your buyers really ask before they buy, in their exact wording. Keep questions that already name your brand separate, since they inflate the numbers.
- The engines. Which AI engines you will check. Xtrusio asks ChatGPT, Claude, Gemini, Perplexity, Grok, Google AI Overviews and Google AI Mode.
- The goal. What change counts as success, for example "named in 10 more points of answers on our priority questions, with no drop in sentiment". Write the goal down first, or any movement can be made to look like a win. Then take a baseline. Xtrusio keeps every full answer, every brand it names and every page it cites, so the "before" picture is a record you can open later, not a number someone remembers.
The six GEO statistics to track
Statistic | How to calculate it | What it tells you |
|---|---|---|
Visibility (mention rate) | Answers that name your brand divided by all answers checked | How often buyers see you at all |
Exact-page citations | Answers that cite one of your URLs divided by all answers checked | Whether engines trust your pages as a source |
Share of voice | Your brand mentions divided by mentions of every tracked brand | Your slice of the conversation against named competitors |
Sentiment | Share of mentions that are positive, neutral or negative | Whether the engine describes you the way you want |
Average position | Your average place when an answer lists several options | Whether you are the first pick or an afterthought |
AI referral visits | Visits from AI engines in your analytics, by landing page | Whether answers send people to your site |
Xtrusio reports the first five by engine, topic and buyer persona. The sixth comes from your own analytics, as explained below.
Visibility (mention rate)
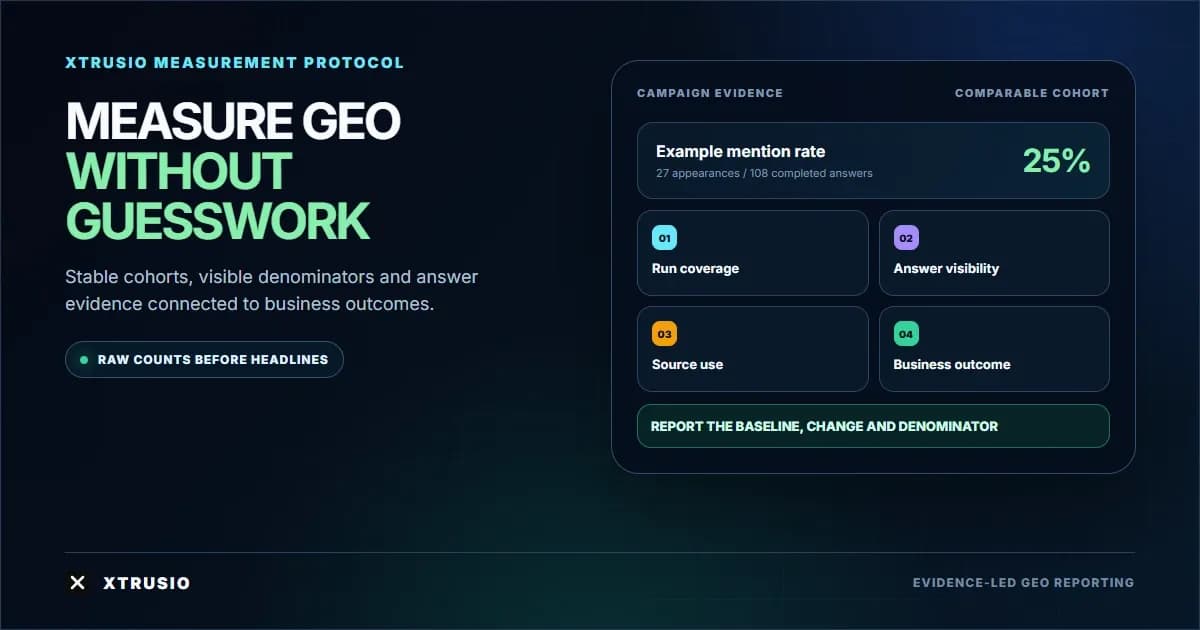
This is the headline number. Count each answer once: an answer that names you three times is still one mention. Report the count beside the percentage ("18 of 108 answers") so a small sample cannot look bigger than it is. A mention is not a recommendation: an answer that names you as an option to avoid still counts, which is why sentiment sits beside it.
Citations of your exact pages
A citation is the link an engine shows as its source. This is the statistic that proves a campaign worked, because it connects a specific page you published to a specific answer. Track citations at the URL level, not the domain level. If the engine cites your homepage while you were trying to win with a new comparison guide, the guide has not worked yet. In Xtrusio, a page counts as a win only when an engine's answer to the question it targets cites that exact URL in a later scan. Also track the third-party pages engines cite: review sites, LinkedIn, Medium, Reddit, YouTube, industry publications and press coverage. If those pages cite or mention you, they count toward your campaign too.
Share of voice
Share of voice compares you with a fixed list of competitors. Keep that list the same across periods, or the number moves for reasons that have nothing to do with your work. If no tracked brand appears in an answer, leave that answer out of the share-of-voice math rather than counting it as zero.
Sentiment
Read how the answer describes you. Is it accurate, or does it repeat an old complaint? A campaign that lifts visibility while sentiment falls is not a success. Xtrusio scores sentiment for every mention so you can see the change on the same questions.
Average position
When an answer lists several tools or vendors, your place in that list matters. Only count position where the answer actually gives an order. A mention inside a paragraph is not a rank.
AI referral visits
Answers that send visitors leave a trail in your analytics. OpenAI's publisher FAQ says ChatGPT referral links include utm_source=chatgpt.com, so you can filter those visits by landing page. Google also gives site owners a view of AI search. It announced generative AI performance reports in Search Console in June 2026, and its Search report help page says they have rolled out to all websites worldwide. These cover your whole site, so treat them as supporting evidence, not as proof that one page caused the change. A referral is a visit, not every time a buyer saw your name; many people read the answer and never click.
How to compare before and after fairly
Equal totals are not enough. Compare the same question on the same engine in both periods. A simple illustration: in the baseline you are named in 18 of 108 usable answers (16.7%); after the campaign, 27 of 108 (25%). But if different checks failed in each period, those are not the same 108 answers. Compare only the questions that returned an answer in both periods, and report gains and losses separately. If 12 answers gained a mention and 6 lost one, the net gain is 6, not 12. Break results down by engine and priority question, since a gain on one engine can hide a drop on another.
Tie every result to the work that caused it
You also need to show what changed the answers. Keep a simple work log for each piece:
- The buyer question it targets.
- The live URL and the date it went live.
- Where it was published: your blog, LinkedIn, Medium, Reddit, YouTube, a guest post or a press placement.
- The date of the next check on that question. Xtrusio does this as part of the work. It drafts a content plan for each buyer question from the searches the engines actually ran and the sites they cite, with the right channel for each piece, and you approve the plan. Link Strategy then tracks each guest post, PR placement and published piece through to its live URL and shows whether an engine cites the live URL for the question it targets. In Xtrusio's checks, ChatGPT and Claude search the web on every answer, and Gemini and Grok decide when to search. Xtrusio records the searches ChatGPT, Claude, Gemini and Grok run, so you can see the exact search phrases your pages need to match.
How will you know the campaign worked?
Run this test at the end of each campaign stage:
- Same questions, same engines. Did you compare the exact questions from your baseline?
- Exact-page citations. For each page you published, does an engine's answer to its target question now cite that URL?
- Visibility and share of voice. Did mention rate and share of voice rise on your priority questions, with losses shown next to gains?
- Sentiment and position. Did the description stay accurate, and did your place in lists hold or improve?
- Visits. Do AI referral visits to the cited pages show up in your analytics? If the answer to point 2 is yes, you have direct proof. If only visibility moved, you have a promising signal and should check again on the next scan. Google Search Console health in Xtrusio adds a safety net: it connects to Google Search Console and flags pages losing position, demand or freshness, with the reason in plain words, so a campaign win does not hide a slide somewhere else. For the executive version of this report, see our CMO AI visibility metrics scorecard. For how to keep records over time, read the guide to historical AI search data.
Where the GEO numbers come from
The term comes from the GEO research paper, accepted at KDD 2024, which tested visibility measures on 10,000 queries. Use it to understand the ideas; measure your own buyer questions for proof.
See how Xtrusio measures and proves GEO results, starting with your own buyer questions.
Frequently asked questions
What is the most important metric for GEO campaign success?
Citations of your exact pages. Visibility shows whether buyers see you, but a citation of the URL you published, on the question it targets, is what proves the campaign caused the change. Track it alongside mention rate, share of voice, sentiment and position.
How do you calculate GEO mention rate?
Divide the answers that name your brand by all the answers you checked for your fixed set of buyer questions. Count each answer once, keep failed checks out of the total, and show the count beside the percentage.
Is a rise in citations proof that a GEO campaign worked?
It is strong evidence when the same question, on the same engine, now cites the exact page you published for it. A general rise in domain citations is a good sign, but tie it to specific pages before you call it a win.
How often should you report GEO campaign results?
Monthly works for most teams, with an extra check after a big launch or a reputation issue. Keep the same core questions every time and label any new questions separately.
Can a GEO campaign guarantee citations in ChatGPT?
No. The engine decides what to cite. What you can do is publish the pages and win the placements engines trust, then check whether they cite them. Xtrusio is built around that last check.
Topics
- measure GEO campaign success
- generative engine optimization statistics
- GEO metrics
- AI visibility campaign reporting
- AI citation measurement

Xtrusio
AI visibility research
Xtrusio is the Perception Engine for B2B brands.
Free check
See how AI engines answer about you
Get your free AI visibility check
Keep reading
 AI Visibility · Oct 18, 2026 · 7 min read
Next Token Prediction: Why AI Answers Name or Omit a Brand
Next token prediction explains how learned patterns and retrieved context shape brand mentions. Use an anonymized scan example to choose the next action. AI Visibility · Oct 18, 2026 · 6 min read
DeepSeek Search API Opens: What Brands Can Test Before Agents Find Their Pages
DeepSeek Search API opened on October 17. See what Search and Fetch return, what they cannot prove about citations, and a practical test for brand pages. AI Visibility · Oct 18, 2026 · 9 min read